Predicting the 2026 World Cup Group Stage - A Monte Carlo Simulation Deep Dive

Introduction
The 2026 FIFA World Cup will be the largest in history, featuring 48 teams across 12 groups. I ran a comprehensive Monte Carlo simulation — 100,000 iterations — accounting for player injuries, red cards, altitude, and H2H records to predict which teams make it out of the group stage.
We'll explore the data collection, modeling techniques, and fascinating insights revealed by running 100,000 simulations of the group stage.
Important note: I've used live betting odds to choose the last four spots open for the World Cup. These teams (including Italy) will finish up their matches in late March.
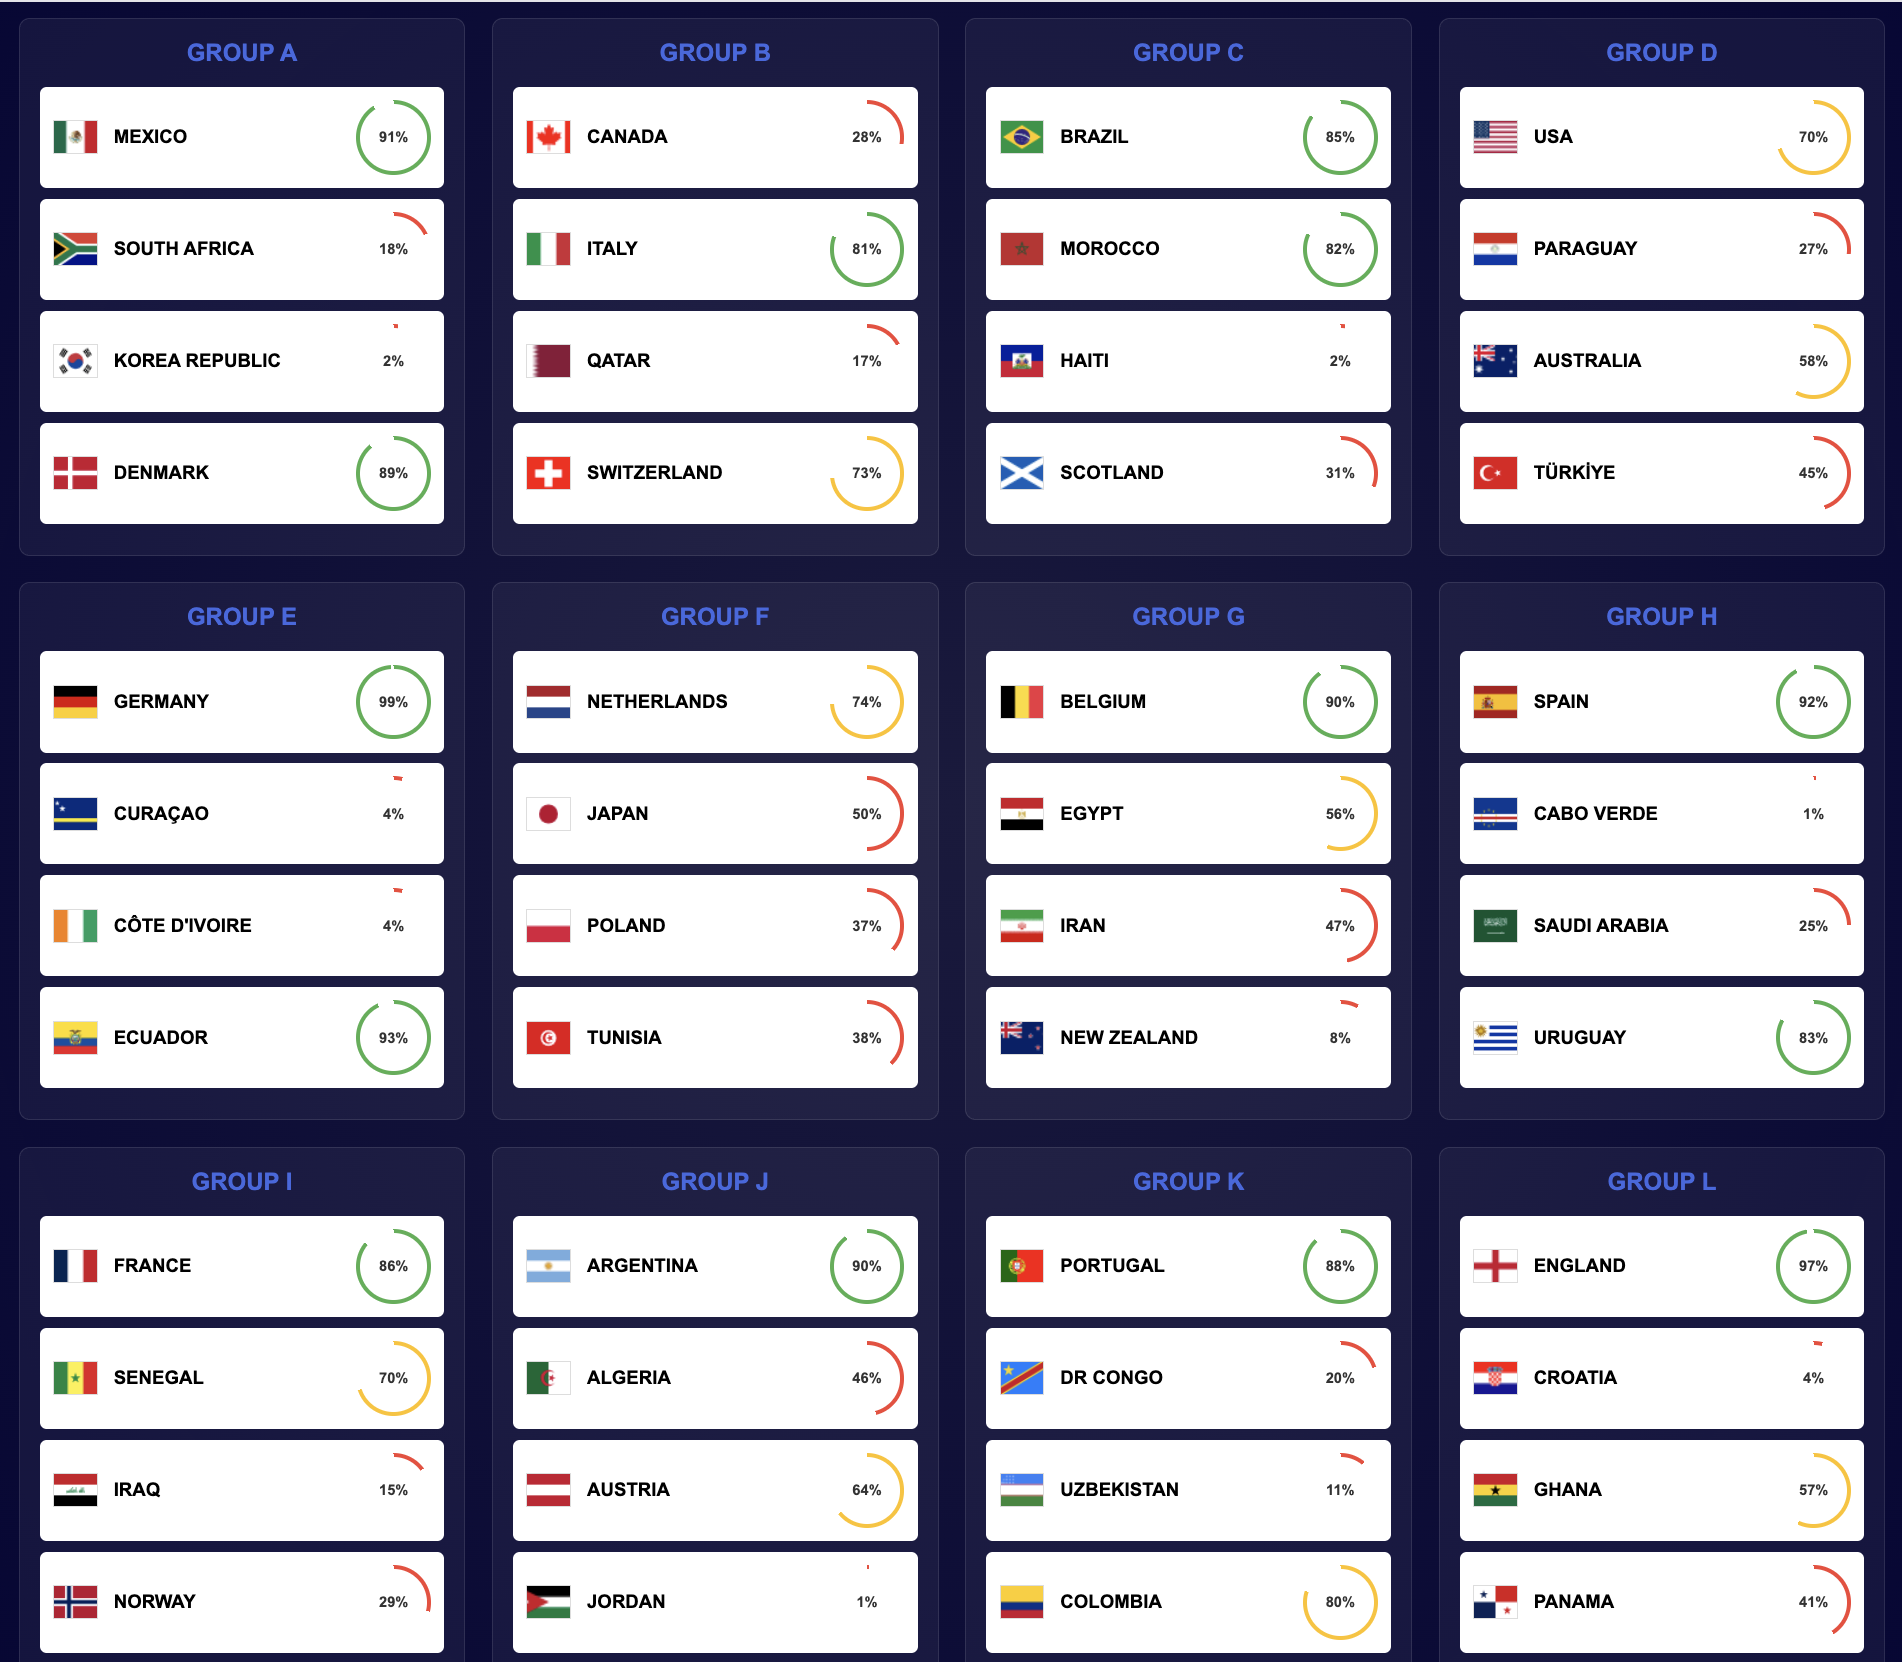
Here's a sneak peek at the results!
Probability of Advancement to Eliminations, by Team
The Monte Carlo Approach
Monte Carlo simulation is a statistical technique that runs thousands of iterations of a probabilistic model to estimate the likelihood of different outcomes. In our case, we simulate the group stage 100,000 times, tracking which teams finish first, second, third, and which third-place teams advance to the knockout rounds.
Why 100,000 iterations? More iterations lead to more stable probability estimates. With 100,000 runs, we can confidently distinguish between teams with similar strengths and identify unlikely but possible outcomes (upsets). For the group stage, this means we can accurately predict advancement probabilities even when teams are separated by just a few percentage points.
Data Collection: Real Data, Multiple Sources
The foundation of any good prediction model is quality data. Our system collects real data from multiple free sources:
Squad Data Collection
Transfermarkt.com serves as our primary source for national team squads. We locate:
- Player names and positions
- Ages and club affiliations
- National team appearances and statistics We fall back to WorldFootball.net, Wikipedia, or Football-Data.org in case this data is missing from Transfermarkt.
The DataCollector class orchestrates this multi-source approach, caching results locally to avoid repeated requests:
class DataCollector:
    def collect_all_squads(self, teams, enrich_with_stats=False):
        """Collects squad data from multiple sources with fallback logic."""
        squads = {}
        for team in teams:
            # Try Transfermarkt first
            squad = self.transfermarkt.get_national_team_squad(team)
            if not squad:
                # Fallback to WorldFootball
                squad = self.worldfootball.get_squad(team)
            # ... more fallbacks
            squads[team] = squad
        return squads
Head-to-Head Records
Historical match records provide crucial context. We scrape H2H data from:
- Wikipedia team statistics pages
- WorldFootball.net match histories
- Soccerway historical fixtures
The system aggregates matches from the last 10 years, calculating win rates, goal differences, and recent form trends. Importantly, we don't want to pick too long or too short of a time horizon because squads change all the time.
FIFA Rankings Integration
FIFA World Rankings provide a baseline for team strength. We use them as a primary factor (95% weight) in team strength calculations, blended with squad-based metrics (5% weight).
Team Strength Calculation
Team strength is the core metric that drives match predictions. We calculate it through a multi-layered approach:
1. Player Rating System
Each player receives a composite rating based on:
- Club Performance: Goals, assists, appearances, minutes played
- National Team Performance: Caps, goals, assists for country
- Position Weighting: Forwards and attacking midfielders weighted higher
- Age Factor: Peak performance assumed around 26-28 years
class PlayerRatingCalculator:
    def calculate_composite_rating(self, player_data):
        """Calculates weighted composite rating from club and national stats."""
        club_rating = self.calculate_club_rating(player_data)
        national_rating = self.calculate_national_rating(player_data)

        # Weighted combination (60% club, 40% national)
        composite = 0.6 * club_rating + 0.4 * national_rating

        return composite
2. Squad Aggregation
Team strength aggregates individual player ratings:
- Starting XI Average: Core team strength
- Squad Depth Bonus: Stronger benches provide tactical flexibility
- Positional Balance: Ensures realistic team composition
3. FIFA Rankings Blending
When squad data is incomplete or unreliable, FIFA rankings provide a robust fallback. The final team strength blends FIFA-derived strength (95%) with squad-based strength (5%):
def calculate_team_strengths_from_squads(squads, use_fifa_rankings=True):
    fifa_rankings = load_fifa_rankings()

    for team_name, squad in squads.items():
        # Calculate squad-based strength
        squad_strength = aggregate_player_ratings(squad)

        # Get FIFA-based strength (rank 1 -> ~95, rank 50 -> ~75)
        fifa_base = convert_fifa_rank_to_strength(fifa_rankings[team_name])

        # Blend: 95% FIFA, 5% squad
        final_strength = 0.95 * fifa_base + 0.05 * squad_strength

        # Ensure teams with good squad data aren't penalized
        team_strengths[team_name] = max(fifa_base, final_strength)
This approach ensures that:
- Top-ranked teams (Spain, Argentina, France) have appropriately high strengths (~90-95)
- Lower-ranked teams have realistic lower strengths (~70-80)
- Strength differences translate to meaningful win probability differences
Match Prediction Model
Matches are simulated using a Poisson distribution model, which is standard in football analytics. The model:
- Calculates expected goals (λ) for each team based on strength
- Samples actual goals from Poisson distributions
- Determines match outcome (win/draw/loss)
Expected Goals Calculation
The code for calculating expected goals is as follows.
class MatchModel:
    def calculate_expected_goals(self, team1_strength, team2_strength,
                                  h2h_adjustment, altitude_adjustment):
        # Linear mapping: strength 70 -> 0.3 goals, strength 95 -> 4.2 goals
        min_strength, max_strength = 70.0, 95.0
        min_goals, max_goals = 0.3, 4.2

        # Interpolate strength to expected goals
        lambda1 = min_goals + ((team1_strength - min_strength) /
                               (max_strength - min_strength)) * (max_goals - min_goals)
        lambda2 = min_goals + ((team2_strength - min_strength) /
                               (max_strength - min_strength)) * (max_goals - min_goals)

        # Apply adjustments
        lambda1 *= (1 + h2h_adjustment + altitude_adjustment)
        lambda2 *= (1 - h2h_adjustment)

        return lambda1, lambda2
Example: Spain (strength 93.7) vs Denmark (strength 86.7)
- Spain expected goals: ~4.0
- Denmark expected goals: ~2.2
- Spain win probability: ~65-70%
Match Simulation
def simulate_match(self, team1_strength, team2_strength, ...):
    lambda1, lambda2 = self.calculate_expected_goals(...)

    # Sample goals from Poisson distributions
    goals1 = poisson.rvs(lambda1)
    goals2 = poisson.rvs(lambda2)

    # Determine result
    if goals1 > goals2:
        return {'result': 'team1_win', 'team1_goals': goals1, 'team2_goals': goals2}
    elif goals1 < goals2:
        return {'result': 'team2_win', 'team1_goals': goals1, 'team2_goals': goals2}
    else:
        return {'result': 'draw', 'team1_goals': goals1, 'team2_goals': goals2}
Modeling the Game: Environmental Factors
Altitude Adjustments
The 2026 World Cup features stadiums at varying altitudes:
- Estadio Azteca (Mexico City): 2,240m - significant altitude advantage
- BC Place (Vancouver): 0m - sea level
- Most US stadiums: 0-500m - minimal impact
Teams from high-altitude countries (Mexico, Ecuador, Bolivia) have an advantage when playing at altitude. Non-acclimatized teams suffer performance degradation. We enact a strength penalty according to how high up the stadium is past 1500m. For example, Estadio Azteca at 2,240m elicits a -7.4% penalty to the base team strength of non-acclimatized teams. For acclimatized teams (Mexico, Switzerland, Iran, Turkey, all countries with high average elevations), there is a +3.7% advantage.
Head-to-Head Adjustments
Historical match records influence match outcomes. If Team A has dominated Team B historically, they receive a small strength boost:
class H2HAdjustment:
    def get_h2h_adjustment(self, team1, team2, h2h_matches):
        # Calculate win rate and goal difference from last 10 years
        matches = filter_recent_matches(h2h_matches, years=10)

        team1_wins = count_wins(team1, matches)
        win_rate = team1_wins / len(matches) if matches else 0.5

        # Convert to adjustment factor (-0.2 to +0.2)
        adjustment = (win_rate - 0.5) * 0.4

        return adjustment
Modeling the Game: The Unpredictable Factors
Football is inherently unpredictable. Our model incorporates three types of random events:
1. Injuries
Key players can be injured, reducing team strength:
def simulate_injury(self, squad, random_state):
    """Randomly injures a key player with 5% probability."""
    if np.random.random() < 0.05:  # 5% chance
        key_players = self.get_key_players(squad)
        injured_player = np.random.choice(key_players)
        return -0.1  # 10% strength reduction
    return 0.0
2. Red Cards
Red cards reduce team strength and force tactical adjustments:
def simulate_red_card(self, squad, random_state):
    """Simulates red card with 3% probability."""
    if np.random.random() < 0.03:  # 3% chance
        return -0.15  # 15% strength reduction
    return 0.0
3. Off-Game Performance
Even the best players have off days. We model this as temporary strength reduction:
def simulate_off_game(self, squad, random_state):
    """Simulates key player having an off game (10% probability)."""
    if np.random.random() < 0.10:  # 10% chance
        return -0.08  # 8% strength reduction
    return 0.0
These events are applied per match, ensuring that each simulation iteration has unique randomness while maintaining statistical validity over 100,000 runs.
Simulation Process
Group Stage
The group stage simulates round-robin matches (each team plays the other three teams in their group). The 8 best third-place teams (by points, then goal difference, then goals for) advance to the Round of 32. This adds an extra layer of complexity—teams can advance even if they finish third, making every goal and every point crucial.
Results Aggregation and Visualization
After 100,000 iterations, we aggregate results:
Group Stage Probabilities
For each team, we calculate:
- Probability of finishing 1st in group
- Probability of finishing 2nd in group
- Probability of advancing (1st or 2nd)
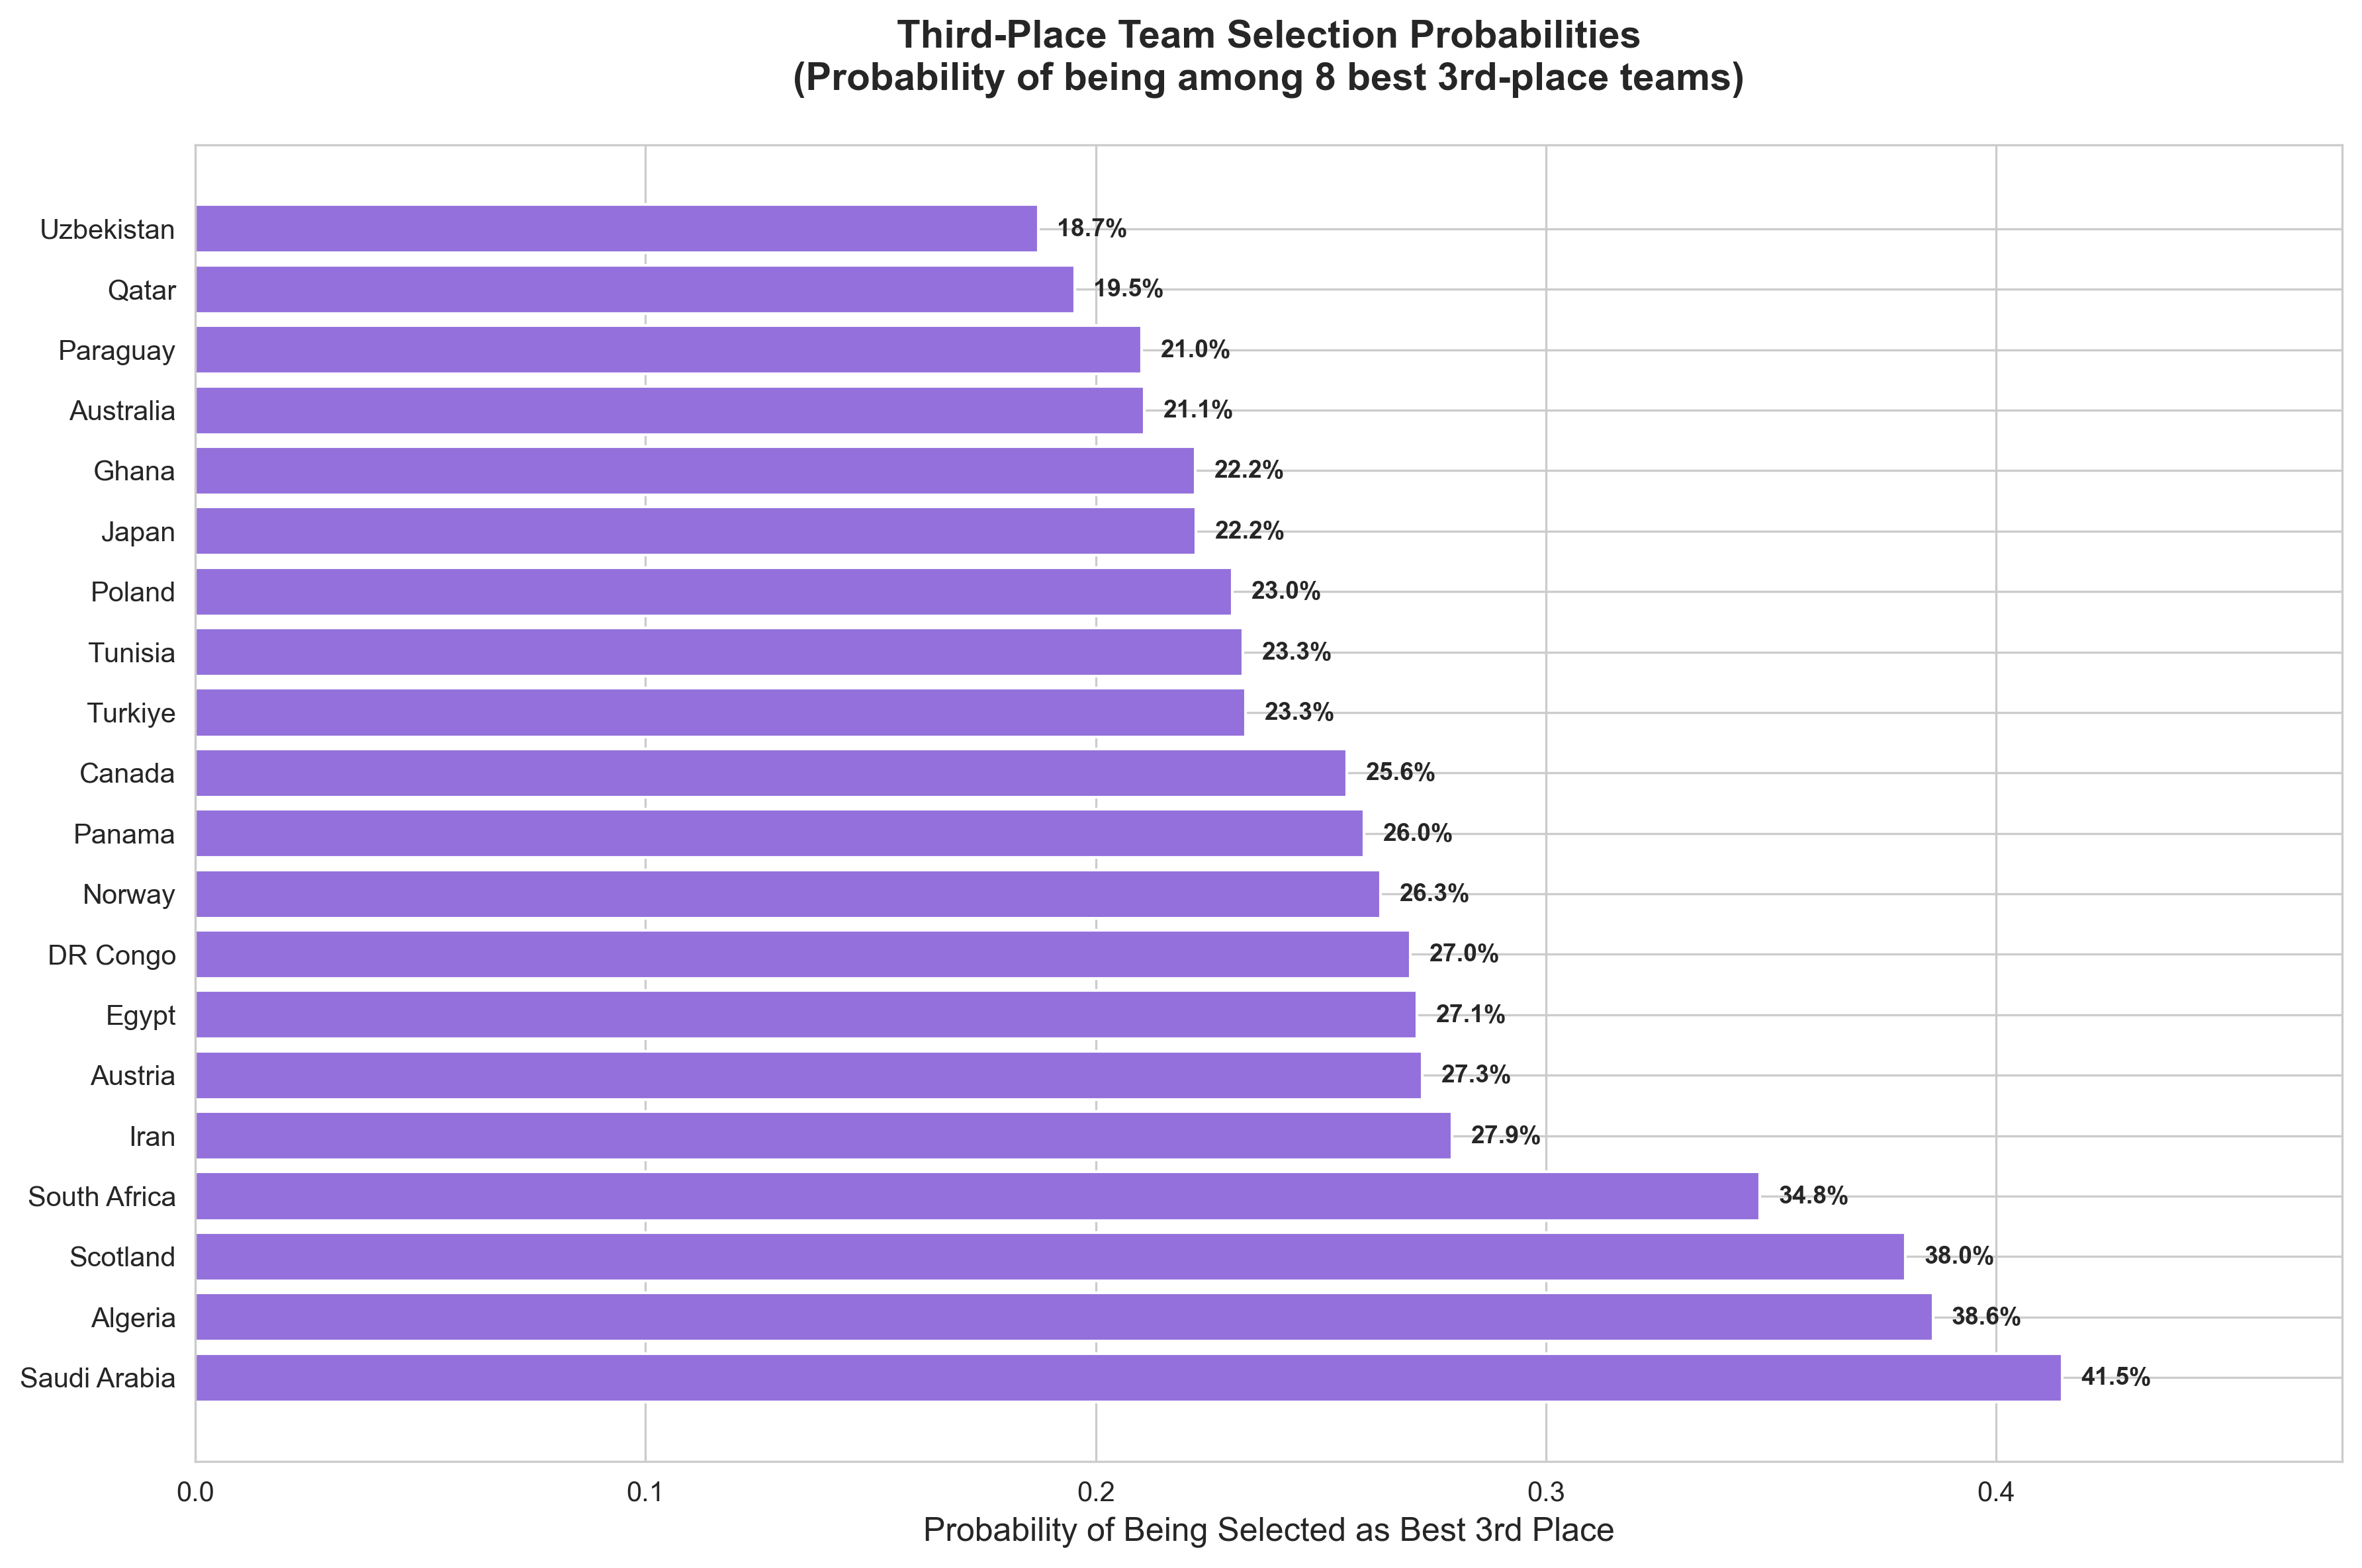
- Probability of being selected as best third-place team
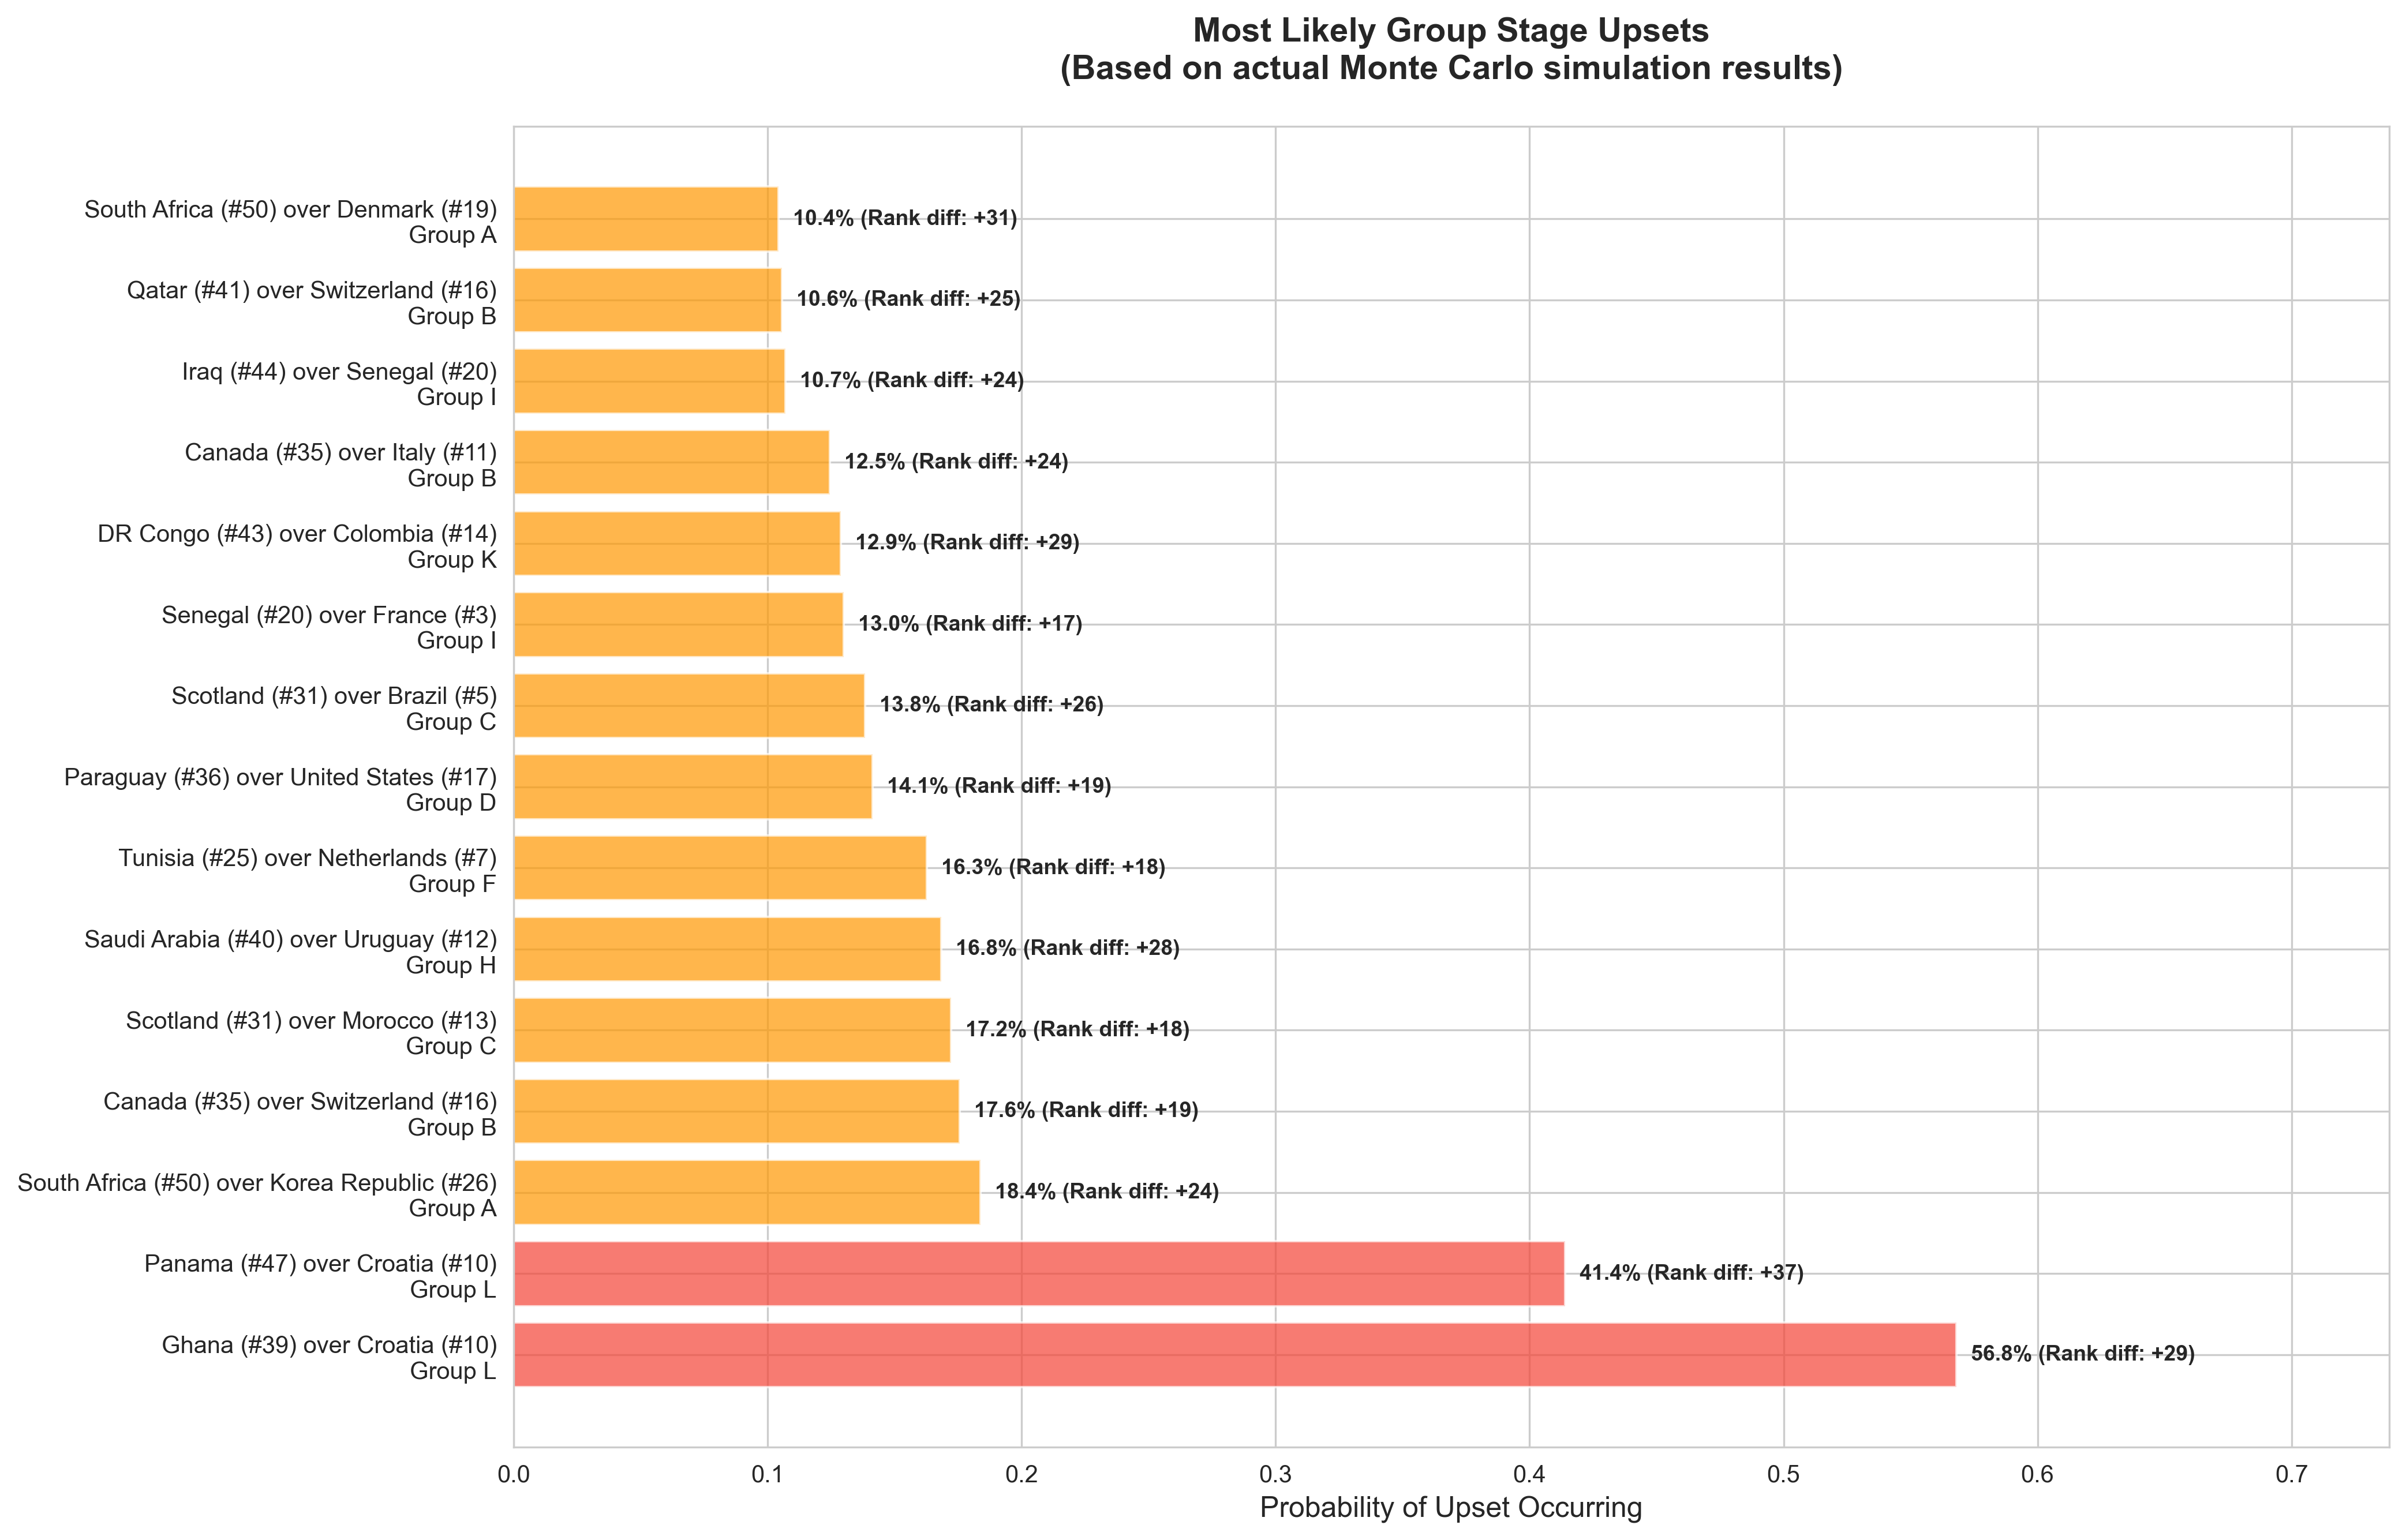
Upset Identification
We identify likely upsets by comparing:
- FIFA ranking differences (≥15 positions)
- Actual advancement probabilities from simulations
Example: If Tunisia (rank 25) advances over Spain (rank 1) in 5% of simulations, that's a notable upset.
Key Results from 100,000 Iterations
Based on the latest simulation run:
Top Group Stage Favorites
- England (Group L): 97.3% advancement probability
- Germany (Group E): 98.8% advancement probability
- Spain (Group H): 91.6% advancement probability
- Argentina (Group J): 89.9% advancement probability
Most Competitive Groups
- Group F (Netherlands, Japan, Tunisia, Poland): All teams have 30-75% advancement probability
- Group D (USA, Australia, Turkiye, Paraguay): Tight race for second place
Analysis and Commentary: What the Numbers Tell Us
After running 100,000 simulations, the results reveal fascinating patterns, surprising insights, and compelling storylines for the 2026 World Cup. Let's dive into what the data actually means.
The Statistical Locks
- Germany's Dominance in Group E (98.8% advancement). Relatively weaker opponents in Ecuador, Curaçao, and Côte d'Ivoire.
- England's Near-Perfect Path in Group L (97.3% advancement). Croatia and Ghana have historically been great teams but have been struggling recently. The race for 2nd in this group is a tough one with Ghana (47.6% advancement) and Panama (36.1% advancement) neck-and-neck.
The Chaotic Groups
Group F (Netherlands, Japan, Tunisia, Poland) is the statistical equivalent of a coin flip. The Netherlands are the favorite to advance, but that's only standing at ~75%. The other three teams in the group (Japan, Tunisia, and Poland) have incredibly close advancement probabilities and are good teams in their own right.
The USA's Golden Chance
United States (Group D) has a 70.1% advancement probability. Group D is tough but there's a strong chance they're able to overcome the challenge from Australia and Turkiye.
The Analysis: The US benefits from home-field advantage in our model (though we set it to 0 for neutral venues), but the data suggests their group is genuinely competitive. The simulation shows:
- USA finishes first: 42.6%
- Australia finishes first: 28.6%
- Turkiye finishes first: 19.4%
The interesting part about the 2026 world cup is that the "home advantage" is not necessarily as strong for the United States, as support for South American countries and border neighbors (i.e., Canada and Mexico) is very present.
Ecuador's Altitude Advantage
Ecuador in Group E has a fascinating profile: they only win the group 27.8% of the time (Germany dominates), but they advance 93.4% of the time. Even more interesting: they finish second 65.7% of the time.
Why This Matters: Ecuador benefits from altitude familiarity. While Germany plays at sea level in most matches, Ecuador's players are accustomed to high-altitude conditions. In matches played at elevated stadiums (like Estadio Azteca at 2,240m), Ecuador gains a meaningful advantage.
The Commentary: This is a perfect example of how environmental factors create statistical anomalies. Ecuador isn't necessarily a better team than Germany, but in specific conditions (high-altitude matches), they become competitive. The simulation captures this nuance: Ecuador's 93.4% advancement probability reflects both their team strength and their environmental advantages.
The Cinderella Stories
Several teams with lower FIFA rankings show surprising advancement probabilities:
Ghana (Group L): 57% advancement probability despite being ranked lower than Croatia. The simulation suggests Ghana's squad depth and recent form give them an edge over a Croatia team that may be past its peak.
Egypt (Group G): 55.8% advancement probability, competing closely with Iran (47%) for second place behind Belgium. This reflects Egypt's strong individual talent (Mohamed Salah) and tactical organization.
Tunisia (Group F): 38.2% advancement probability in the "Group of Death." While this seems low, it's actually impressive given the competition. Tunisia has a real chance to advance, which would be a significant upset.
The Insight: These probabilities aren't just numbers—they represent genuine pathways to advancement. A 38% chance means that in 38,000 out of 100,000 simulations, Tunisia advances. That's not a fluke; it's a reflection of their actual competitiveness.
The Statistical Anomalies
Croatia's Collapse: Ranked higher than Ghana, but only has a 4.3% advancement probability. This suggests Croatia's FIFA ranking may be inflated by past success, while their current squad strength is lower.
Cabo Verde's Near-Zero Chance: 0.7% advancement probability in Group H with Spain and Uruguay. This isn't just about being weak — it's about being in an impossible group. Even a decent team would struggle here.
Korea Republic's Disappointment: Only 1.9% advancement probability in Group A. This reflects both Korea's relative weakness and the strength of Mexico and Denmark. The simulation suggests Korea would need multiple upsets to advance. This is one I don't necessarily agree with - South Korea always plays with heart and can certainly find a way to get it done.
The Third-Place Battle: The New Wildcard
With 8 third-place teams advancing, the simulation reveals interesting patterns:
Teams like Scotland (Group C) have a 30.9% advancement probability overall, but much of that comes from third-place finishes. They're unlikely to beat Brazil or Morocco for top two, but they have a real shot at being one of the 8 best third-place teams.
The Strategic Implication: In the new 48-team format, finishing third isn't necessarily failure. Teams can advance with 3-4 points if goal difference is favorable. This changes group stage tactics—teams might play more conservatively, knowing a draw could be enough.
The Randomness Factor: Why 100,000 Iterations Matter
One of the most important insights from running 100,000 simulations is understanding the range of possible outcomes:
- Most Likely Outcome: Spain, Argentina, France, and England all advance from groups and reach the quarterfinals
- Plausible Upset: A team like Tunisia or Japan advances from Group F and makes a deep run
- Extreme Upset: A team like Cabo Verde or Korea Republic somehow advances (0.7% and 1.9% respectively)
The Commentary: The beauty of Monte Carlo simulation is that it doesn't just give us the most likely outcome — it shows us all possible outcomes and their probabilities. A 1% chance event happens 1,000 times in 100,000 simulations.
The Human Element: What the Model Can't Capture
While the simulation is comprehensive, it can't account for:
- Managerial Tactics: A brilliant tactical setup can overcome strength differences
- Team Chemistry: Some teams play better than the sum of their parts
- Momentum: A team that starts poorly might find form later
- Injuries to Key Players: While we model random injuries, a pre-tournament injury to a star player changes everything
- Psychological Factors: Pressure, expectations, and mental fortitude matter
The Reality Check: The simulation gives us probabilities, not certainties. Spain has a 91.6% chance of advancing, but that means they fail 8.4% of the time. In the real World Cup, that 8.4% could happen on day one.
Final Thoughts: The Beauty of Uncertainty
What makes this simulation compelling isn't just the accuracy of its predictions—it's the way it captures football's inherent unpredictability. A 97% probability still leaves room for the impossible. A 3% probability still represents thousands of possible futures.
The 2026 World Cup will write its own story, but these 100,000 simulated tournaments give us a glimpse into the most likely narratives. Whether it's Germany's dominance, Group F's chaos, or an underdog's Cinderella run, the numbers tell us which stories are most likely — and which are waiting to surprise us.