Outages are up since coding agents shipped. I checked the status pages.


GitHub had a major outage today... again. If anyone feels like they've been extra down lately - it's not just you. We've got a problem in software and even OpenAI and Anthropic don't know how to solve it.
Outages and incidents are up pretty much across the board at both the AI labs and heavily relied-upon infra. My guess is that coding agents are proving more than any engineering team can handle right now - everyone's sacrificing speed for quality and it's coming back to bite.
Wonder if it's lack of engineering discipline, lack of enterprise-standard testing harnesses, or if the latest models really just benchmark gains.
Time is money - investing in building the right way wins in the long run.
That was my LinkedIn post. It was a guess. Here is what I found when I went and pulled the numbers.
Why I care
When GitHub Actions goes down, builds stop. When a model provider degrades, every agent depending on it stalls mid-task. A lot of teams have quietly made this layer a hard dependency for how they ship. If it is getting flakier, that is an operating cost, and most people are not tracking it.
What I looked at
Nearly every public status page exposes its incident history, so I pulled them. For GitHub I used the per-component uptime pages back to 2016. For Anthropic, Datadog, Supabase and the comparison companies I used their Statuspage histories, and for OpenAI its status API. I counted every published incident except scheduled maintenance. "Major or critical" means the severity label each page uses itself, except for OpenAI, where I counted partial or full component outages.
One catch up front: all of this is only what companies choose to publish.
GitHub: total downtime is flat, full outages are not
I split GitHub's history at Copilot going generally available (June 21, 2022) and at the Copilot coding agent launch (May 19, 2025). These are averages across the eight core services: Git, API, Issues, Pull Requests, Actions, Webhooks, Packages and Pages.
| Era | Outage hours per service per 30 days | Major outage hours | Actions major outage hours | Incidents per 30 days |
|---|---|---|---|---|
| Sep 2020 to Jun 2022 | 2.25 | 0.25 | 0.93 | 6.4 |
| Jun 2022 to May 2025 | 2.18 | 0.18 | 0.31 | 7.1 |
| May 2025 to Oct 2026 | 2.33 | 0.44 | 1.43 | 8.6 |
Incident counts in the first row start in January 2021, because older incidents carry no IDs.
Total downtime barely moved. What changed is how bad the bad days are. Full outages more than doubled, Actions full outages went up almost fivefold from the Copilot era, and incidents per month rose about 20%. In the first nine months of 2026, GitHub logged 98 distinct incidents across those services. In all of 2024 it logged 56.
Two things keep this honest. May 2023 was the worst month on record at 86 outage hours, and that was long before agent-scale traffic. And one month, August 2026, added 26 hours of major outage on its own, mostly Actions, which pulls up the latest era's average.
Five companies, each against its own baseline
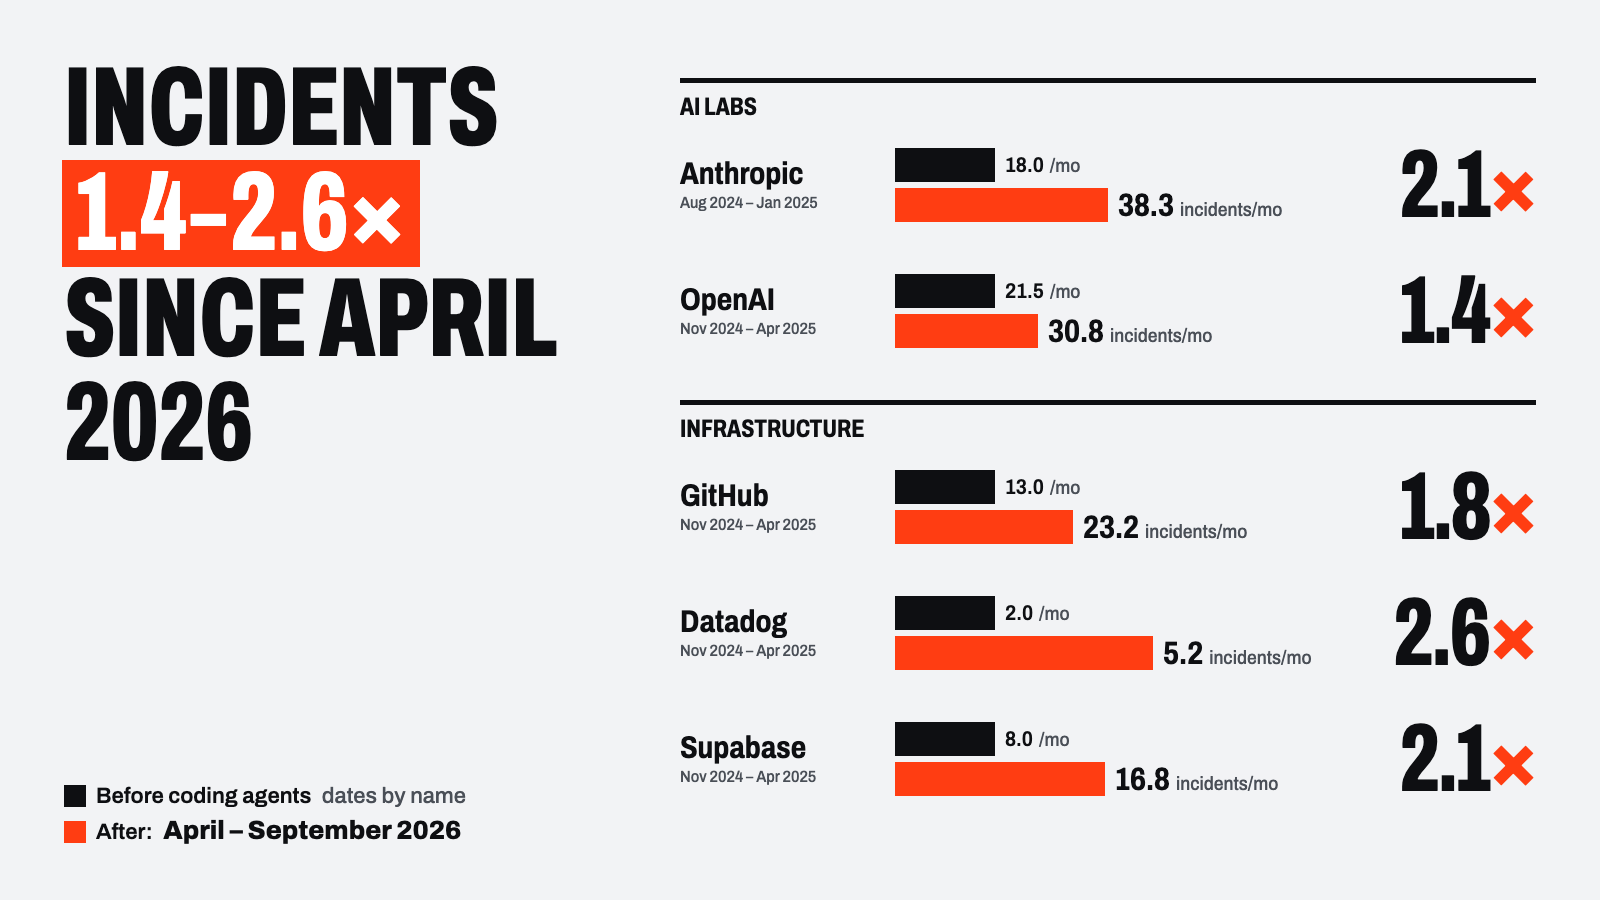
I said the problem is "across the board," so I tested it. The fair way to do that is to give each company a "before" that matches when it actually got access to coding agents. I used the six months before each adoption date and compared that to April through September 2026.
| Company | Adoption date used | Before window | Before (incidents/mo) | After (incidents/mo) | Multiple |
|---|---|---|---|---|---|
| Anthropic | Claude Code launch, Feb 2025 | Aug 2024 to Jan 2025 | 18.0 | 38.3 | 2.1× |
| OpenAI | Codex launch, May 2025 | Nov 2024 to Apr 2025 | 21.5 | 30.8 | 1.4× |
| GitHub | Copilot coding agent, May 2025 | Nov 2024 to Apr 2025 | 13.0 | 23.2 | 1.8× |
| Datadog | May 2025 (proxy) | Nov 2024 to Apr 2025 | 2.0 | 5.2 | 2.6× |
| Supabase | May 2025 (proxy) | Nov 2024 to Apr 2025 | 8.0 | 16.8 | 2.1× |
I have no documented adoption date for Datadog or Supabase, so they use the industry launch date. Datadog's counts are small, so its multiple moves easily.
Every company is up. That part of my post holds.
My guess is only half right
I said coding agents are the reason. The data does not back that up cleanly, because most of these curves were already rising before agents showed up.
Anthropic is the clearest example:
| Half-year | H1 2023 | H2 2023 | H1 2024 | H2 2024 | H1 2025 | H2 2025 | H1 2026 |
|---|---|---|---|---|---|---|---|
| Incidents per month | 2.0 | 3.0 | 12.7 | 18.7 | 24.0 | 31.7 | 45.3 |
That is three years of steady climbing with no visible break when Claude Code launched. It looks like a company growing fast, not a step change. OpenAI jumped from 12.2 a month in late 2024 to 26.7 in early 2025, before Codex existed, and has been roughly flat since.
To account for this, I fit a line through each company's 12 months before adoption, projected it forward, and compared the actual rate to that projection:
| Company | Actual vs trend-predicted |
|---|---|
| OpenAI | 0.7× (below trend) |
| GitHub | 1.1× |
| Anthropic | 1.45× |
| Supabase | 2.1× |
| Datadog | Not computable (counts too small and noisy) |
Twelve monthly points make for a rough fit, so read this as directional. The ordering holds up though. Existing trends explain most of OpenAI's rise and a big chunk of GitHub's and Anthropic's. Supabase was flat before and is up 2.1× since, which looks like a real step change.
Is it a software problem or an AI problem?
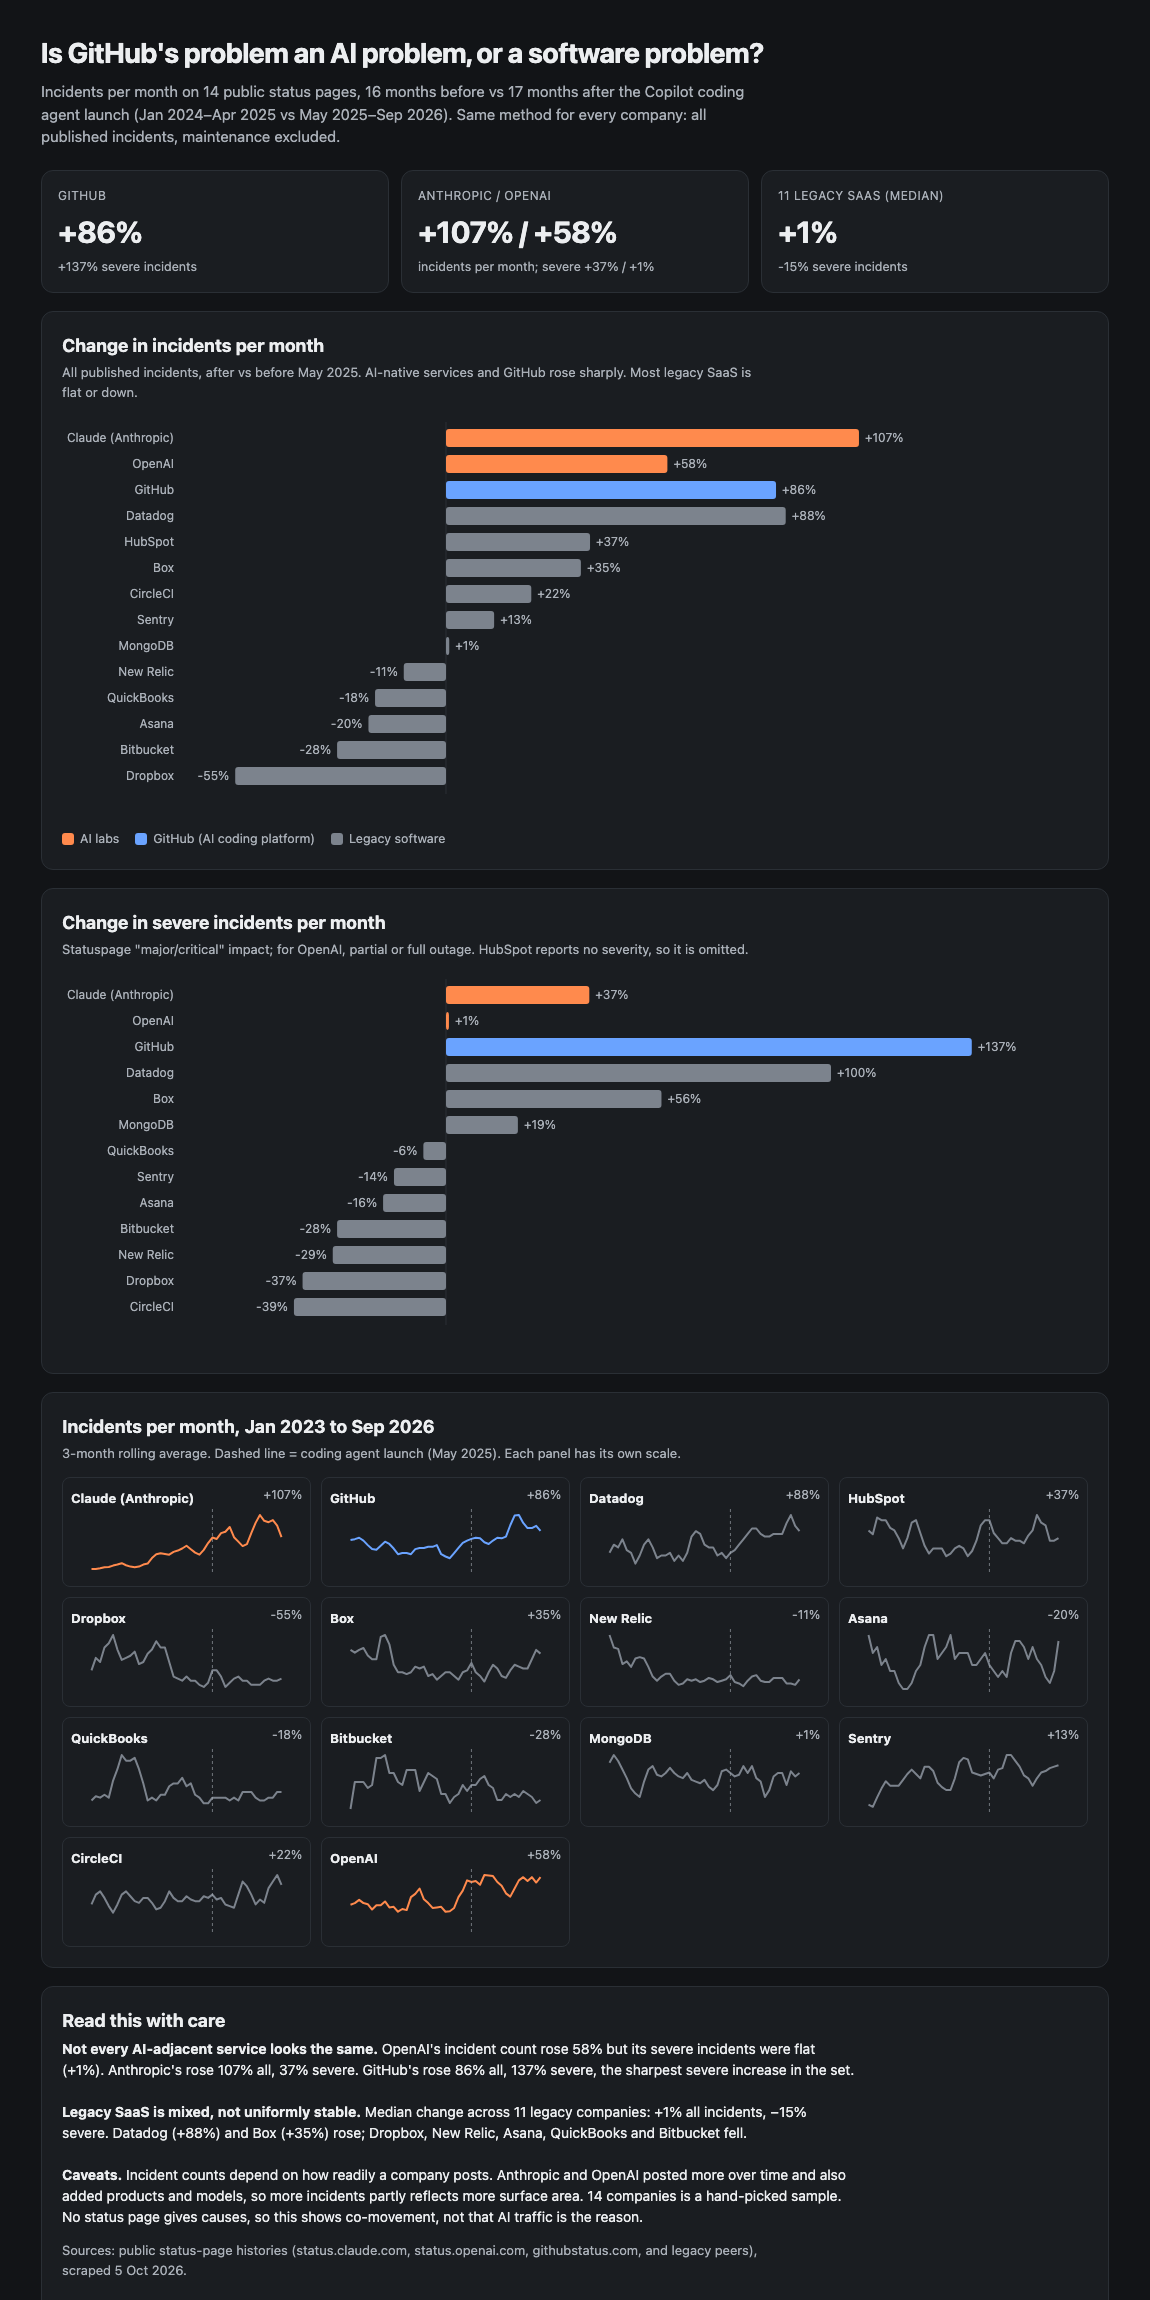
I compared January 2024 to April 2025 against May 2025 to September 2026 across 11 established SaaS companies: Datadog, HubSpot, Dropbox, Box, New Relic, Asana, QuickBooks, Bitbucket, MongoDB, Sentry and CircleCI. The median change in incidents per month was +1%, and -15% for major or critical incidents. Over the same windows GitHub was up 86% overall and 137% for severe incidents, Anthropic up 107% and 37%, and OpenAI up 58% and 1%.
Legacy software is not uniformly stable. Datadog (+88%) and Box (+35%) rose, while Dropbox, New Relic, Asana, QuickBooks and Bitbucket fell. But the typical mature company is flat while the AI-adjacent ones are not.
What about companies that use agents heavily?
This is the test I would most like to run, and the data is thin. Coinbase said in July 2026 that 95 to 100 percent of its code is written by or with LLMs, up from about 40 percent in February. Its status page shows 21 to 36 percent more incidents per month depending on the window. That is up, but nowhere near a doubling.
Amazon is the best-known case the other way. The Financial Times reported that its Kiro agent deleted and recreated a production environment, causing a 13-hour outage of one AWS service in one region in December 2025. Amazon disputes the framing and blames misconfigured access controls. I could not measure it, since AWS has no comparable public history. Robinhood and Shopify have talked about heavy AI code adoption too, but neither publishes a usable status history. I treat all of this as anecdote.
What I can't tell you
My post wondered whether this is a lack of engineering discipline, a lack of enterprise-standard testing harnesses, or models that benchmark better than they perform. Status pages cannot separate those. A few other limits:
- Reporting practice. A company that posts every small blip looks worse than one that posts only big outages. Anthropic and OpenAI have published more incidents over time.
- Product growth. The labs added products, models and components. More surface area means more incidents without any drop in quality.
- Sample selection. Fourteen companies, hand-picked from those with usable history.
- No causes. A status page says something broke, not why.
Takeaway
Incident rates are up 1.4 to 2.6 times at GitHub, Anthropic, OpenAI, Datadog and Supabase since coding agents shipped, while the median legacy SaaS company is flat. After adjusting for trends that were already running, the effect shrinks at the AI labs and holds at Supabase and, to a lesser degree, GitHub. So my guess was right that the problem is real and wrong to assume agents alone explain it. What I would still bet on is the last line of my post: time is money, and teams that build the right way, with real test harnesses, staged rollouts and fallbacks for GitHub and model-provider outages, will win as reliability becomes the thing everyone is quietly paying for.